Business Visualization: Observation 30. Using business systems to explain Knowledge Visualization. 2008
Observation:
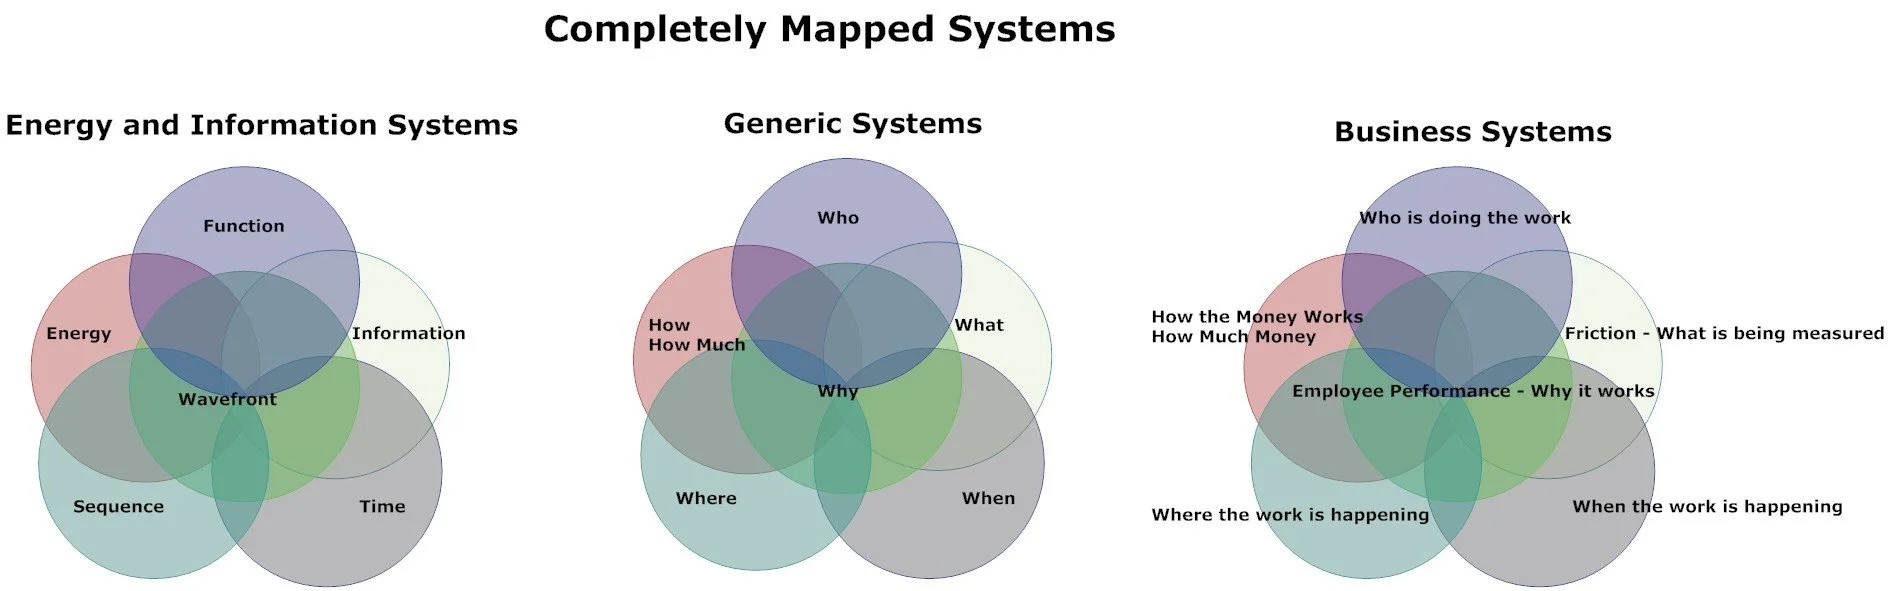
The story emphasizes the significance of understanding and visualizing complex business systems through simple, accessible tools like drawings and colors. The author, by using the concepts of business visualization, simplifies intricate models of energy transfer and information systems for broader comprehension and application in enhancing business efficiency. This approach aims at making business operations more profitable and efficient, facilitating a better flow of money and resources.
The Lesson:
Understanding and visualizing complex concepts in simpler, more relatable ways can significantly improve efficiency and effectiveness in business and learning.
How this is Helpful:
Simplification: Makes complex ideas easier to grasp.
Efficiency: Helps in enhancing business operations.
Creativity: Encourages innovative thinking and problem-solving.
Questions for Reflection:
What’s Simple? How can I simplify complex ideas in my daily life or work?
Why Visualize? Why is visualization important in understanding and solving problems?
Where’s Efficiency? How can I make my activities more efficient and impactful?
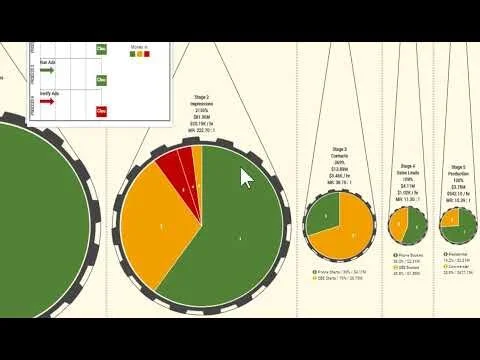
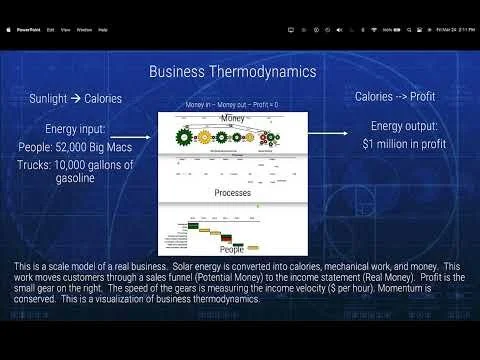
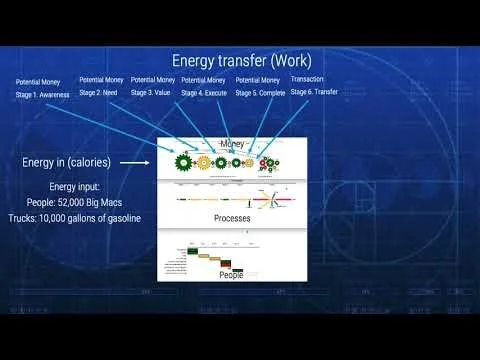
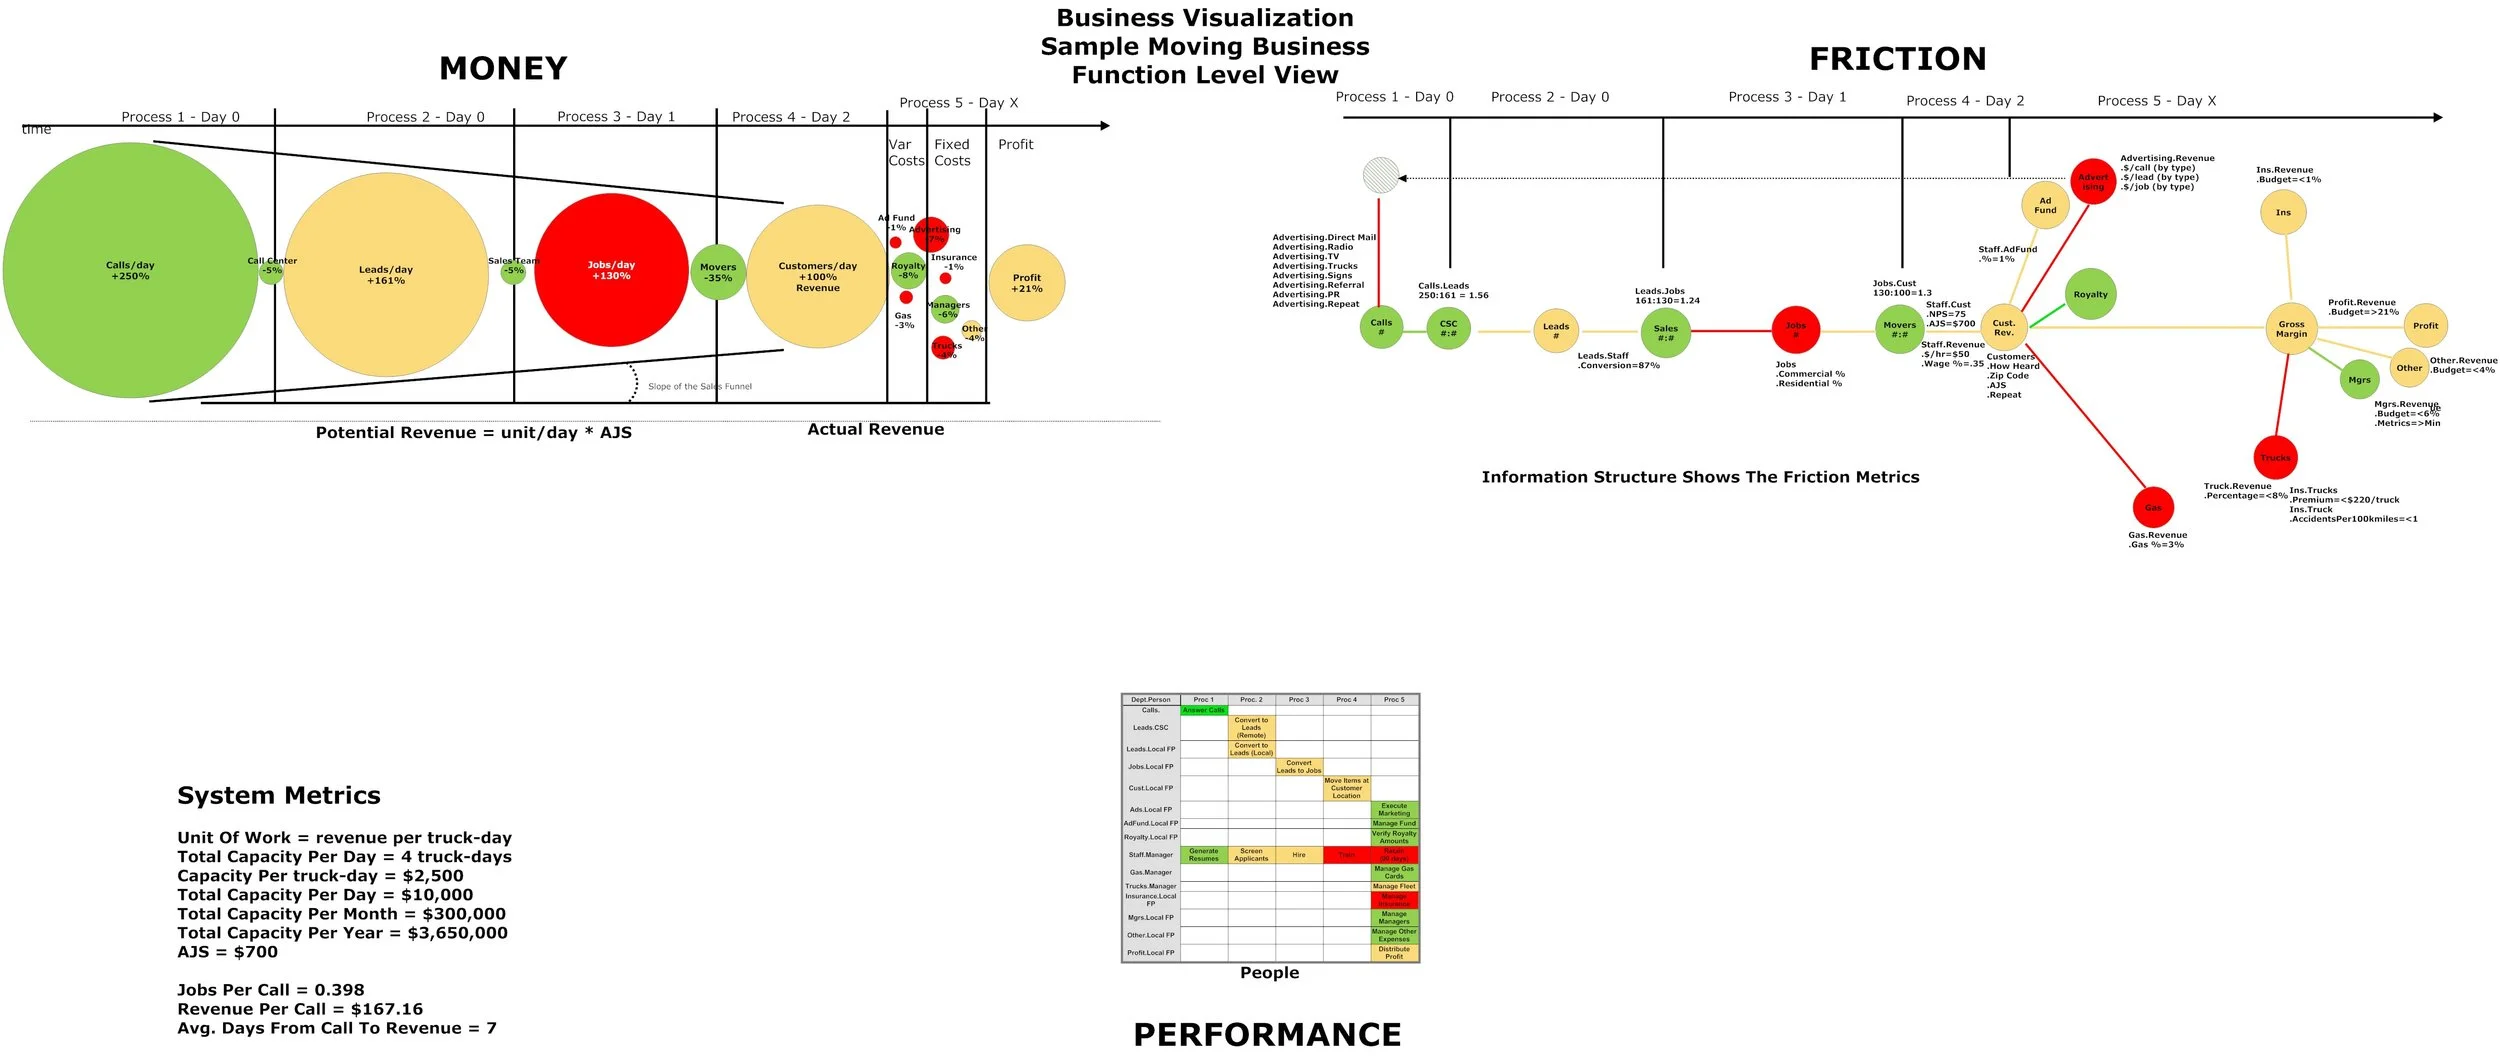
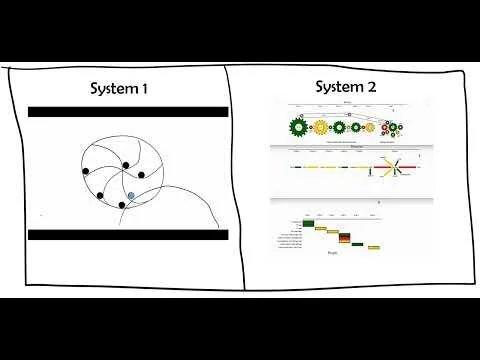
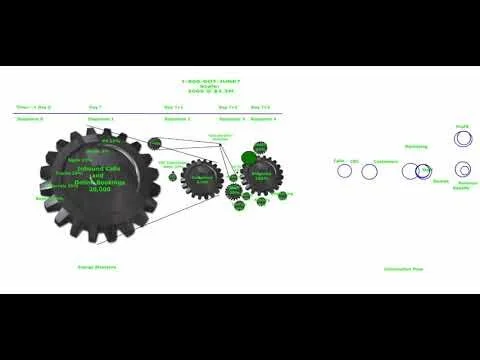
This video describes a way to create a scale model of the money flowing through a business.
All systems can be visualized in a scale model that shows the value of the energy, the flow of the energy, the rules that convert potential energy into kinetic energy, and what is happening.