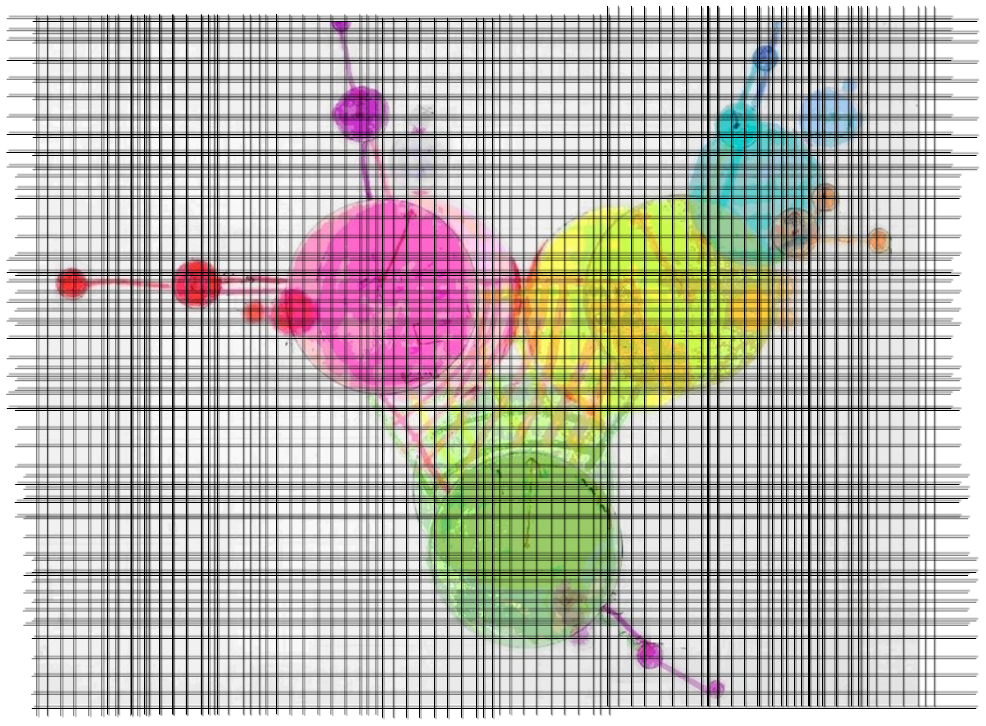
Nonlinear: Observation 14. It’s possible to visualize the flow of energy through a system. 1985
Observation:
I learned to understand dynamic systems by visualizing them as energy and information systems. By observing a marble's movement down a ramp, I could track its position, velocity, and energy loss due to friction, all visualized through color-coded spatial models. This method helped me grasp complex concepts like mass, gravity, and energy transfer in a tangible, visual way.
The Lesson:
Visualizing dynamic systems in detailed, proportional models can provide deep insights into how things work, from simple physics to complex business and data systems.
How this is helpful:
Understanding Complexity: Simplifies complex concepts.
Visual Learning: Enhances learning through visualization.
Application: Aids in applying these concepts to various fields like business and data management.
Questions for Reflection:
How to Visualize? - What other systems or concepts can I visualize to understand better?
Why Models? - Why are visual models effective in understanding complex systems?
What's Next? - How can I use this method to solve real-world problems or create new projects?


